Reports and dashboards in software for lending business lighten the load for analytics, financial officers, and managers in banks and non-banking organizations. They highlight numbers and demonstrate dynamics anytime and anywhere.
The main advantage of automatic dashboards is that no more need to wait for traditional monthly reports. For example, with HES Lending software users leverage financial automation and visualization tools and move to a daily reporting cycle. Traditional and alternative lenders we work with usually ask about our predefined set of reports and add their own ones.
What Are the Key Capabilities of Financial Dashboards in Lending?
- It creates powerful financial analytics to gain insights, explore and analyze trends, timely adapt the business strategy.
- The reports can combine multiple data sources for a complete picture and for access to unified real-time data.
- Such easy access to data reveals the power of more complicated data analytics for reliable forecasting and budgeting.
- Automatic reporting enables analysts to spend more time searching for ways to reduce costs and grow profits and less time on data preparation in spreadsheets.
In between reporting periods, it is important to have access to quick reports that make transform tons of data into an easy-to-read summary. Everything in a dashboard is duplicated somewhere in the company’s papers and financial reporting systems, but real-time snapshots of the key lending data are a must-have when you develop back-office for lending.
With the Reports & Statistics module in the back-office, lenders track their relevant lending KPIs, make cash management decisions, track expenses, and profits to stick to their financial objectives or even outperform them.
Read also


Using Dashboard Reports to Keep Lending Business on Track
Internal statistics and reports tend to visualize data the way that is relevant for management. In financial services the requirements are wider, thus a modified version of the dashboard report in lending is required.
What is relevant depends on the type of lending and type of customers, business operations, sources of collateral.
Which KPIs Lenders Want to Have at Hand?
However, here are four pairs of indicators most lenders would like to include in dashboards:
- The visualization of their revenues and gross margin
- The current ratio of assets and liabilities
- Interest coverage ratio and interest expense.
- Total asset turnover and total loan production
In addition, lenders tend to measure:
- Closing cycle time
- Loan yield spread
- Loan origination unit cost
- Application pull-through rate, and more.
The analysis of these parameters and their dynamics is important in benchmarking and also helps lenders to timely identify trends that need involvement and corrective actions.
Traditional and alternative lenders may have different KPIs, so do lenders working in different industries: auto loans, mortgage lending, commercial, and consumer lending.
The main tasks of a lending software developer are to offer flexibility, find the proper solutions for gathering statistics and implement custom reports and dashboards. At the stage of business analysis, HES FinTech works on the back-office module containing statistics and reports. The team becomes a proactive technology partner: we consider customer’s expectations, demonstrate templates and capabilities, mention development costs.
Customized Reports and Dashboards? Yes!
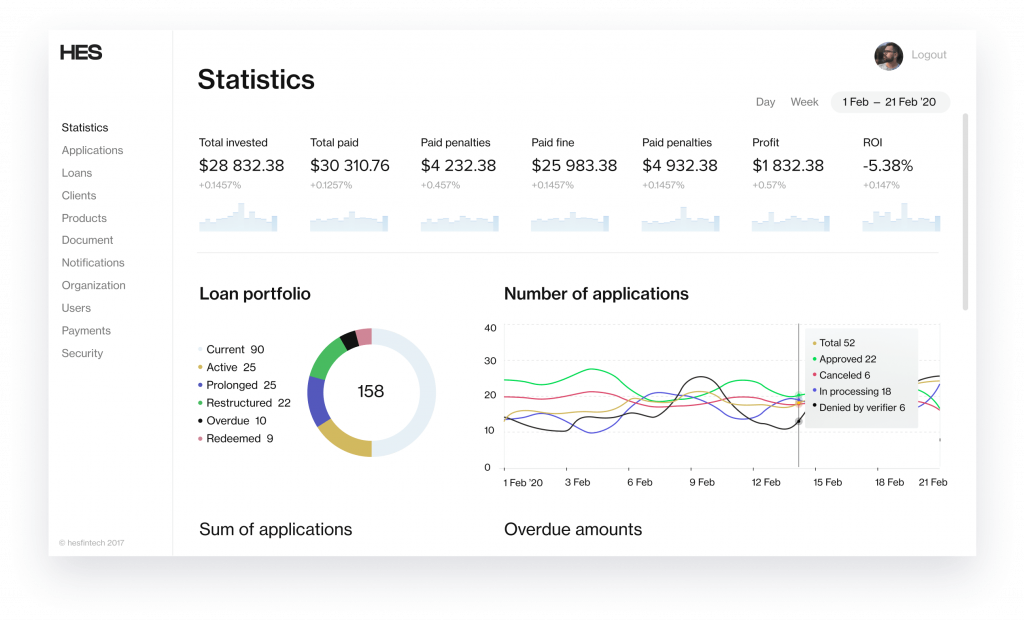
In addition to the widespread KPIs, here're the indicators to visualize on the lending dashboard:
- Credit portfolio statistics (contracts: active, overdue, repaid, closed, cancelled, and contracts with suspended accruals)
- Current balance (outstanding principal balance, accrued interest, and penalties)
- Disbursed and Repaid loans (total amount disbursed, principal amount and insurance amount, refinanced amount, total repaid amount, principal/accrued interest/penalties repaid, total repaid amount)
- Key daily/weekly/monthly lending business indicators (disbursed loan amount, insurance amount, refinanced amount, repaid total, principal repaid, accrued interest repaid, penalties repaid).
- Loan applications (number of applications, total amount of applications)
- Overdue contracts and overdue amounts, and a lot more.
Psss... Wanna start lending within 90 days?

The Bottom Line
Banks and financial institutions are now under great internal pressure to deliver valuable insights and turn this knowledge into action to boost the performance of lending. Financial dashboards for lenders help them measure and clearly see the dynamics in real-time.
Finance experts and risk managers can validate figures faster and drill into financial details when they need.
The goal of HES FinTech, a loan management software provider, is to bring data to your fingertips, provide lenders with analysis options and visualize their KPIs in a configurable and intelligent lending platform.
All that creates limitless opportunities and helps to replace the traditional tedious approach to figures and statistics with updated reporting and data analysis. Generate immediate insights and power up your lending business with top-notch dashboards.
Interested in lending software? Join a Live Demo to learn more about our software for lenders.