Loan performance metrics turn raw loan data into a clear view of portfolio quality, profitability, risk, and operational performance. As part of financial key performance indicators (KPIs), lending KPIs help managers of financial institutions track the performance and growth of the lending business, understand how it is progressing toward its goals, and identify areas for improvement.
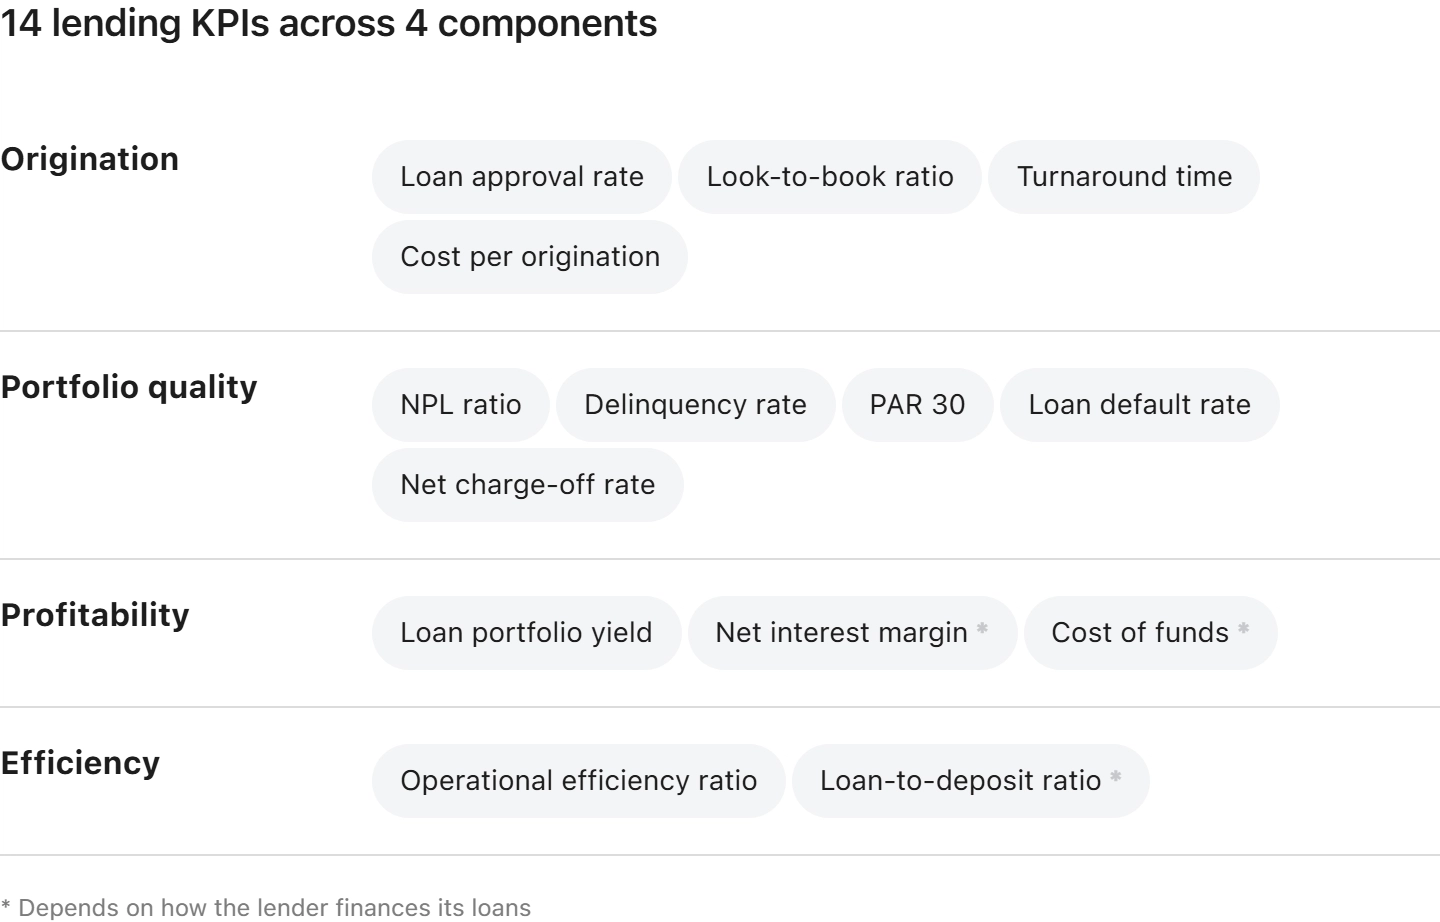
This article covers 14 lending KPIs across 4 key components of loan performance: origination, portfolio quality, profitability, and efficiency. You’ll find typical ranges in the benchmarks table, with the source and period provided for each figure, so you can assess performance and identify areas where the financial business can improve.
Statistical Overview
According to the report, global banking balances rose from $381 trillion in 2024 to $406 trillion in 2025, while bank profits increased by 7% year on year to $1.3 trillion. Global net interest margins remained relatively stable, declining slightly from 1.65% to 1.63%.
At the same time, credit quality remains an important concern. US household debt reached $18.8 trillion in the second quarter of 2026, with 4.7% of outstanding debt in some stage of delinquency. Together, these figures show why lenders need to track both financial performance and portfolio quality rather than focus on growth alone.
Effective KPI monitoring helps lenders assess portfolio health, profitability, and operational performance, identify emerging risks, and make informed decisions.
The 14 Lending KPIs at a Glance
Most of these 14 lending metrics can be used by any lender. The other three we describe below depend on how the lender finances its loans.
LDR is relevant when loans are funded by customer deposits because it shows how much of those deposits is being used for lending. NIM and CoF matter when a lender relies on external funding, as the cost of that funding directly affects its lending margin. If a lender uses its own capital, these metrics provide less useful information.
Leading vs Lagging Indicators
Most of the 14 metrics are lagging, outcome-based measures: they report losses that have already occurred.
Leading indicators are metrics that provide an early signal of a potential change in future performance or risk. None of the 14 is a pure leading indicator, which is why lenders also track key risk indicators (KRIs) outside this set: first-payment default, the early delinquency rate, the roll rate, the auto-decisioning rate, and the days-past-due trend between buckets.
KRIs feed the risk appetite statement and the weekly credit review, while the 14 KPIs go to management and board reporting.
| Lagging KPIs | Leading KRIs | |
|---|---|---|
| What it reports | Outcomes that already occurred | Early signal of future risk |
| Examples | Net charge-off rate, NPL ratio | First-payment default, roll rate, DPD trend |
| Where it goes | Management and board reporting | Risk appetite statement, weekly credit review |
Origination KPI Set: Measuring Lending Decisions
When comparing lender KPIs, make sure they are calculated in the same way. Soft-pull prequalification inquiries are not applications, and counting them as such inflates every ratio in this group. Results also vary with lending criteria such as loan-to-value, debt-to-income, and payment-to-income for consumer loans and debt service coverage ratio for commercial loans. These criteria affect the KPI for underwriter teams: move loan-to-value or debt-to-income, and approval rates, credit decisions, and loan origination KPIs change too.
- Loan Approval Rate shows what percentage of applications are approved. A low rate may mean the credit policy is set tighter than the incoming traffic, or that some channels bring applicants who do not fit that policy, so track it by channel and credit tier. If approval rises alongside early delinquency and first-payment defaults, the credit policy has loosened faster than the scorecard was recalibrated.
- Look-to-Book Ratio shows what percentage of applications become funded loans. Mortgage lenders often calculate it from submitted applications and call it the "pull-through rate", while indirect auto lenders may use approvals. Always specify the denominator. A large gap between approval and funding points to a drop-off after approval rather than to credit policy.
- Turnaround Time (TAT) covers the interval from a completed application to a decision. Read time to decision as two numbers, because an average hides the queue, and the auto-decisioning rate explains the gap. For underwriting teams, the pairing that matters is speed against override rate: decisions made fast and reversed later cost more.
- Cost per Origination shows how much it costs to process and fund one loan. It moves against TAT: manual checks raise costs and slow decisions, while cutting reviews shows up later in delinquency. The calculation also needs marketing data that loan origination software does not hold.
Credit Risk KPI Set: Measuring Portfolio Quality
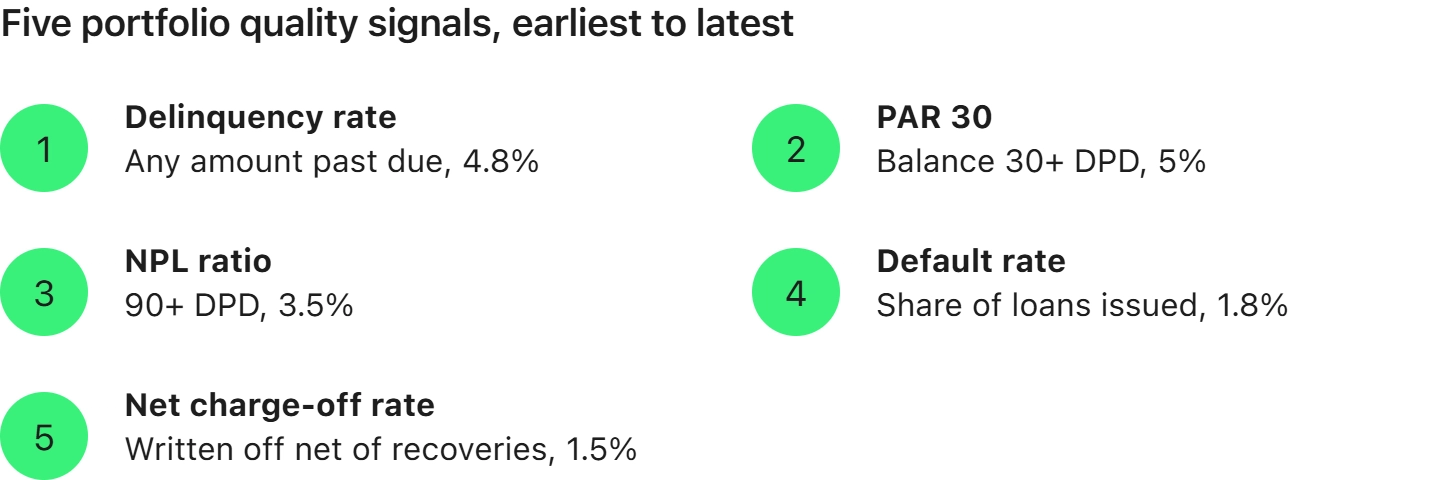
These five loan metrics are closely linked to asset quality and credit risk, showing how a portfolio performs and where signs of deterioration begin to appear. A book can carry rising delinquency alongside a flat 90-day figure for two quarters, and that gap is the early signal. These indicators also inform the measurement of expected credit losses (ECL).
ECL provides the accounting framework, which varies by jurisdiction. Under IFRS 9, more than 30 days past due creates a rebuttable presumption of a significant increase in credit risk, while 90 days past due is a key backstop for default/credit impairment.
Under US GAAP, FASB ASC Topic 326 (the CECL standard) requires expected credit losses to reflect historical experience, current conditions, and reasonable and supportable forecasts.
Both frameworks feed into the allowance for credit losses, while the provision coverage ratio indicates the level of loss-allowance coverage relative to non-performing loans.
- NPL Ratio shows the share of the book unlikely to be repaid in full. The 90 DPD threshold is the common definition, but nonperforming exposures also cover unlikely-to-pay cases where payments are current, so supervisory figures sit above what a loan management system reports on arrears alone. Credit quality read without the loss reserve behind it is incomplete: two lenders at the same level differ if one provisioned twice as much.
- Delinquency Rate counts every loan with an amount past due, the widest and earliest of the five. The level matters less than the days past due trend: a book drifting from the 30-day bucket into the 60-day is deteriorating while the headline holds. Read it by bucket, where roll rate and cure rate become visible.
- Portfolio at Risk (PAR 30) measures the outstanding principal balance of loans that have crossed the 30-day past-due threshold as a percentage of the gross loan portfolio. Unlike an account-based delinquency rate, it gives greater weight to larger exposures, which is why it is widely used in microfinance. Definitions vary in how they treat rescheduled or restructured loans, so the calculation basis should always be disclosed.
- Loan Default Rate measures the share of loans issued in a given period that enter default. Its weakness is the denominator: rapid portfolio growth adds newer loans that have had less time to default, which can make the rate look better than underlying credit performance. Vintage analysis corrects for that by cohort, which loan portfolio management software should do without an export.
- Net Charge-Off Rate (NCO) closes the sequence with losses already written off, net of recoveries, the slowest signal here and the one auditors anchor on. A write-off draws down the allowance rather than creating a new expense, so it is read alongside provision coverage. The recovery side is measured by debt collection software, not the servicing ledger.
Profitability KPI Set: Measuring Financial Performance
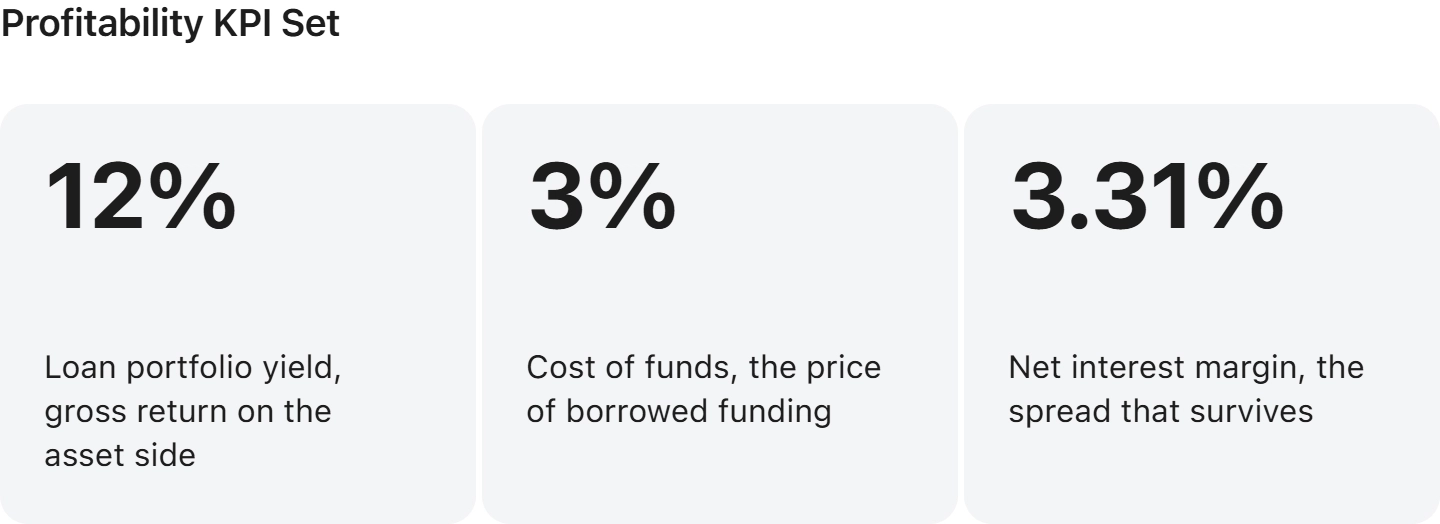
These three metrics read as a chain: LPY on the asset side, CoF on the liability side, and NIM measuring what survives between them. The three use different denominators, so they describe the same economics from three angles rather than adding up.
- Net Interest Margin measures the spread between interest earned on loans and other earning assets and the cost of funding them. A stable NIM can hide two different movements: repricing on the asset side and a shift in the funding mix on the liability side. Separate the two, because a margin that holds steady only because funding gets cheaper while loan yields fall can signal weakening pricing power.
- Loan Portfolio Yield (LPY) reports gross return before funding costs and provisions, so it sits above what the book actually contributes. Pricing up the risk curve lifts yield and expected credit loss at once, so the risk-adjusted version is the one to compare. Profit per account is the counterpart, and among consumer lending KPIs, it is the one that changes pricing in a consumer lending solution with several products.
- Cost of Funds (CoF) prices the capital being lent out, the metric least under an operating team's control, since it follows base rates and the lender's credit standing. What is controllable is mix and duration. Funding capacity, meaning committed lines against planned originations, belongs in the same report, and time to fund is its operational half.
Efficiency KPIs: Measuring Operational Performance
Lending efficiency metrics show how much it costs to run the lending operation. Customer acquisition cost and its payback period are also useful here. Peer comparison here is misleading, because different operating models produce very different cost ratios.
- Operational Efficiency Ratio (OER) shows the cost of running the operation per unit of income. The same calculation circulates as the cost-to-income ratio and the efficiency ratio, and whether loan loss provisions sit in the numerator changes the result, so peer figures rarely line up. Set it against volume: improvement while volume grows is scale; improvement on flat volume is cost work; and only the second lifts operating profit.
- Loan-to-Deposit Ratio (LDR) measures liquidity rather than cost and applies only to institutions funded by deposits. A high value says the book is running ahead of the deposit base; a low one, that deposits are not being put to work. A lender on wholesale lines tracks funding capacity instead.
Model Performance Metrics
Behind every credit decision sits a model whose quality can affect lending KPIs. Key metrics assess how reliably it identifies risk. In HES LoanBox workflows, the Gini coefficient and AUC-ROC measure rank-ordering power and are mathematically related, so one is usually sufficient. The KS statistic measures the separation between performing and defaulting accounts, while the population stability index detects model drift. The override rate shows how often credit staff override model decisions.
Data quality is essential: a scorecard monitoring report based on fields with rising null rates may measure the data pipeline rather than the model. These metrics are not part of the 14 because they assess the model, not the loan book, and belong to model governance and risk management. Monitoring capabilities are therefore important when evaluating credit decisioning software.
Where a lender has no in-house model, a dedicated scoring product can provide similar capabilities. GiniMachine is a separate AI decisioning product in the HES FinTech ecosystem, built for scorecard development and default prediction rather than loan administration. Its reported threefold improvement in scoring accuracy is a vendor claim that should be validated against the lender’s own portfolio.
The 14 Lending KPIs: Comparison Table
| Metric | Formula | What it shows | Component |
|---|---|---|---|
| Loan approval rate | (Approved applications / Total applications) × 100 | Fit between credit policy and applicant flow | Origination |
| Look-to-book ratio | (Funded loans / Applications received) × 100 | Percentage of applications that result in funded loans | Origination |
| Turnaround time (TAT) | Median and 90th percentile of application-to-decision time | Decision speed and queue depth | Origination |
| Cost per origination | Total origination costs / Number of funded loans | Cost of booking one loan | Origination |
| Non-performing loan ratio (NPL ratio) | (Loans 90+ DPD / Gross portfolio) × 100 | Share of the book unlikely to be repaid | Portfolio quality |
| Delinquency rate | (Loans past due / Total loans outstanding) × 100 | Current arrears by days past due (DPD) bucket | Portfolio quality |
| Portfolio at risk (PAR 30) | (Balance of loans 30+ DPD / Gross portfolio) × 100 | Exposure at risk by balance, not loan count | Portfolio quality |
| Loan default rate | (Loans defaulted / Loans issued) × 100 | Share of issued loans that defaulted | Portfolio quality |
| Net charge-off rate (NCO) | [(Charge-offs − Recoveries) / Average portfolio] × 100, annualized | Losses realized, net of recoveries | Portfolio quality |
| Loan portfolio yield (LPY) | (Interest and fees earned / Average portfolio) × 100 | Gross return the book generates | Profitability |
| Net interest margin (NIM) | [(Interest income − Interest expense) / Average earning assets] × 100 | Spread left after funding cost | Profitability |
| Cost of funds (CoF) | (Total interest expense / Average borrowed funds) × 100 | Price paid for the capital lent out | Profitability |
| Operational efficiency ratio (OER) | (Operating expenses / Operating income) × 100 | Operating cost per unit of income | Efficiency |
| Loan-to-deposit ratio (LDR) | (Total loans / Total deposits) × 100 | Liquidity for deposit-funded institutions | Efficiency |
Benchmarks: Context Matters
Benchmarks are useful when the basis of comparison is clear. For example, a level of non-performing loans that is normal for a payday lender may be far too high for a mortgage bank. Definitions also vary across markets, so direct peer comparison can be misleading.
The figures come from regulators, industry associations, and other established industry sources rather than vendor-published fintech KPIs. Public data is more limited for non-bank lenders, so some KPIs do not have a reliable benchmark.
How HES FinTech Helps Move Lending KPIs
Most metrics above come from data a loan management system already holds; the question is whether it produces them without a spreadsheet step.
Reducing the Cost of Loan Acquisition
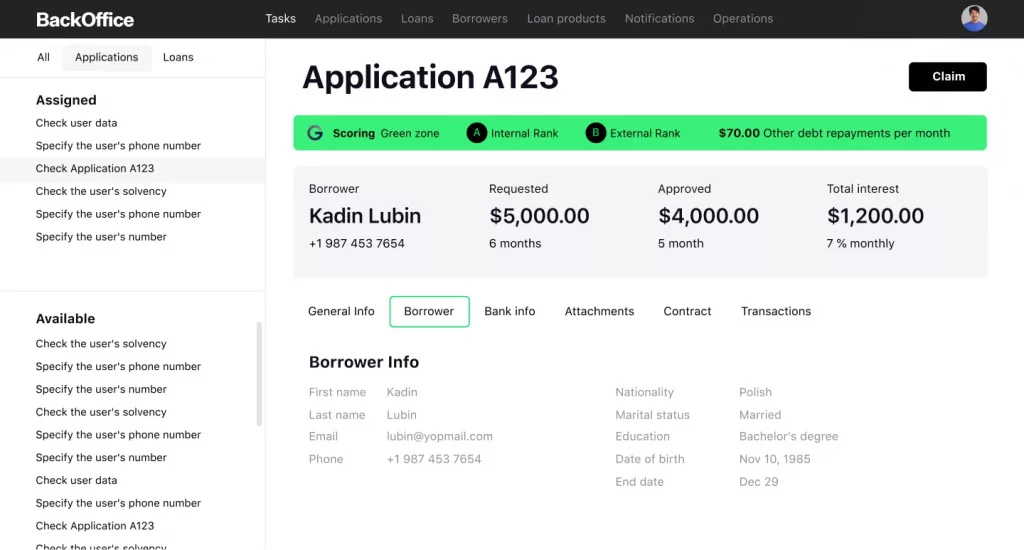
HES LoanBox collects applications through one online front end, while the borrower portal gives customers a single place to apply and track existing loans. Both reduce manual re-keying, which is where cost per origination accumulates.
Improving Operational Efficiency
Configurable workflows and a back office that connects to BI tools let teams build the views behind OER and TAT, including real-time analytics and regulatory reporting, without a spreadsheet step. Fewer manual handoffs also shorten the queue the 90th percentile measures.

Boosting the Customer Retention Rate
Repayment status, schedules, and new applications sit in one place for the borrower, helping support customer retention. A loan calculator also helps borrowers make informed decisions by showing how loan amount, interest rate, and term affect the loan.
Risk Management
Delinquency stages are tracked through the collections workflow as triggers for action, with borrower data and loan history in one place. Decision criteria are configurable, so credit teams set the rules the workflow applies. For lenders keeping their existing core, HES CollectionAgent adds a view categorized by days past due, with an auditable trail behind each action.
Powerful Integrations to Boost Lending Metrics
HES LoanBox counts 100+ integrations alongside an open API, allowing credit bureau and payment provider data to feed into the same reporting layer. This connected setup keeps lending KPI tracking in one place: the platform supplies the operational numbers, while the finance KPIs a board sees are assembled from platform and treasury data.
How Automation Changes Lending KPIs
Client cases show what moves first when origination is rebuilt. Wa'ed reported a 50% cut in decision-making time and a doubling of application volume, with funds reaching borrowers in as little as five minutes. Tavan Bogd Finance calculates loan limits within two minutes without a back-office step, and Idea Bank cut processing time fivefold. All three moved TAT first: origination metrics respond within a quarter, and portfolio quality takes a full vintage.
Conclusion
Here are some of the important loan origination system KPIs and loan servicing KPIs that will allow financial analysts to track the progress and growth of the lending business. HES FinTech offers custom solutions for the lending businesses to ameliorate their services with the power of AI and ML. You can contact the HES FinTech in-house team for a free demo of the solutions to understand all the perks properly.